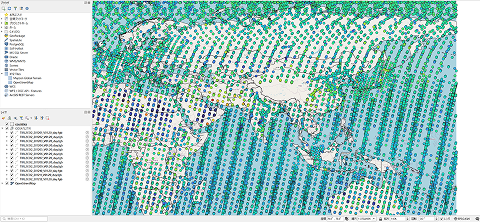
Global Point Cloud 3D Observation Data Visualization Tool (L2 TIR)
- QGIS Plugin
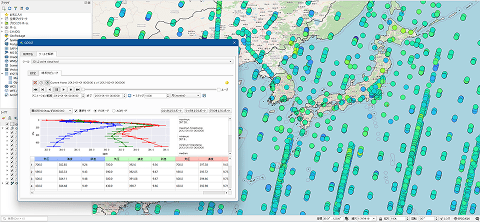
The tool can display a time-series animation of concentration altitude distributions for substances such as CO2 and CH4 as point cloud data. It also provides the graph of observed values for specific POI or AOI, with the function to switch to different pressure levels for display.
Features
Automatic color coding of GOSAT data to be used
When GOSAT data is displayed on a map, it is shown in the same color by default in QGIS. Assigning appropriate colors to each scene based on observation values improves visibility, but it requires setting for each dataset individually, which can be time-consuming. This tool enables you to color-code data in batches.

Graphical display of GOSAT time-series data
GOSAT observes CO2 and CH4 concentrations across multiple atmospheric layers, from the Earth's surface to the top of the atmosphere.
The Global 3D Point Cloud Observation Data Display Tool (L2 TIR) enables you to switch between layers and visualize the concentration of CO2 and CH4 at specific locations through graphs. For example, if you prepare t monthly CO2 concentration data for one certain year and specify a POI on the map, you can display the minimum, maximum, and median observation values for each month over the year. If you select an AOI, the tool can automatically calculate the average values within the range and visualize them in a graph.

Animated display of images in chronological order
Profile data from multiple selected point clouds can be played back as an animation on a QGIS map. This enables you to visually grasp the time-series changes of the observations.
Getting started
QGIS Installation Required
QGIS installation and setup is required. Please refer to the manual for preparation instructions.
GOSAT plugin usage manual (PDF)Target dataset
GOSAT
- GOSAT/L2/TIR CO2 vertical profile(Day side)(G1-04-1)
- GOSAT/L2/TIR CO2 vertical profile(Night side)(G1-04-2)
- GOSAT/L2/TIR CH4 vertical profile(Day side)(G1-05-1)
- GOSAT/L2/TIR CH4 vertical profile(Night side)(G1-05-2)
GOSAT-2
・in preparation
*FlatGeobuf file (.fgb) files for each dataset can be downloaded on QGIS.
Sample projects
For those who are unsure of how to search for and download data, we have prepared a sample project with data previously narrowed down by time period and data interval.
* The sample project is created using data as of March 2025. It may not include the latest data.
| Provider | Tellus |
|---|---|
| Terms of use | GOSAT Plugin Terms of Service |
| Notes | Please use the data in accordance with the GOSAT/GOSAT-2 Data Policy. |
| Environment in which tool can be used | Available outside of Tellus |
| User manual, API reference | GOSAT plugin usage manual |
| Changelog |