TelluSAR
- API
- QGIS Plugin
Features
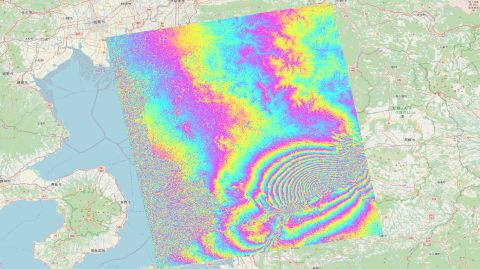
Measure ground subsidence and uplift with centimeter-level precision
By using SAR (Synthetic Aperture Radar) data, it is possible to detect surface changes across large areas at the scale of several centimeters. This makes it useful for monitoring ground subsidence, uplift, and volcanic activity. The technique used for this type of analysis is differential interferometry.
TelluSAR is a tool designed for easily performing differential interferometric analysis with SAR data.
Supported Satellites
- PALSAR: L-band Synthetic Aperture Radar mounted on Advanced Land Observing Satellite “DAICHI” (ALOS)
- PALSAR-2: L-band Synthetic Aperture Radar mounted on Advanced Land Observing Satellite-2 “DAICHI-2” (ALOS-2)
- ASNARO-2: X-band Synthetic Aperture Radar mounted on “ASNARO-2”

Analysis target data is updated regularly
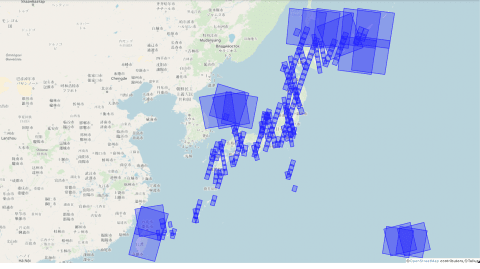
TelluSAR utilizes SAR data available on the Tellus platform. For PALSAR-2, data from observations made over Japan are released sequentially, typically about two weeks after the observation. This allows you to compare and analyze both past and recent data.
In TelluSAR, you can only receive the analysis results after selecting the SAR data for processing, so there is no need to store large original datasets in your own storage.
* The screen image shows the footprint of PALSAR-2 data observed from July 1 to July 15, 2024.
* There may be delays in adding new data.

Support for finding analyzable data
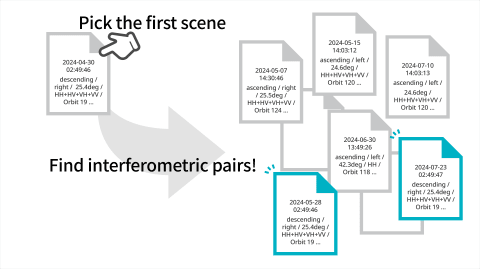
In differential interferometric analysis, two SAR scenes are used for processing. These two scenes must have been observed with the satellite in the same orbit and using the same observation mode. A pair of scenes that meet these conditions is called an "interferometric pair."
TelluSAR helps by automatically narrowing down possible "interferometric pairs" when you specify the first base scene. This eliminates the need to manually check the observation conditions for each scene.

Easy operation with GUI
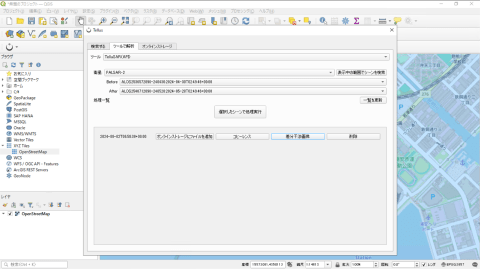
TelluSAR can be executed via API, but we also provide a plugin tool for QGIS. You can specify the area to analyze directly on the QGIS map and search for data. The results can be viewed as images on QGIS, making the analysis intuitive without the need to write code.
The QGIS plugin is available in the Tellus analysis environment, Tellus Satellite Data Master with QGIS. For more details on applying, please visit our Development/Analysis Environment page.

Getting started
By starting to use the tool, you are considered to have agreed to the terms of use.
Step 1: Issue an API token
Create the authentication token required to execute the API. When executing the API, use it as {"Authorization": "Bearer {{issued API token}}"}.
API TokenStep 2: Execute by referring to the API reference
For specific endpoints by function, please refer to the API reference.
API ReferenceStep 1: Subscribe to Tellus Satellite Data Master with QGIS
Subscribe to Tellus Satellite Data Master with QGIS, a remote analysis environment. Check the Development/Analysis Environment page for product lineup and payments methods.
Development/analysis environment pageStep 2: Use QGIS with Pre-installed Plugins
Connect to the remote environment and launch QGIS. The Tellus plugin tools are ready to use.
Target dataset
- PALSAR
- PALSAR-2
- ASNARO-2
| Provider | Tellus Inc. |
|---|---|
| Terms of use | Tellus Service Terms and Conditions (PDF) |
| Notes | - This tool (TelluSAR) version is at 4.0.2. - Even if you select an interferometric pair, there may be cases where no interference occurs. - The interferometric analysis results output by this tool are uncorrected. Stripes unrelated to ground displacement or crustal movement may appear. Copyright notice - In case of using PALSAR, please indicate the following: "Original data provided by JAXA,METI" - In case of using PALSAR-2, please indicate the following: "Original data provided by JAXA" - In case of using ASNARO-2, please indicate the following: "Original data provided by NEC" |
| Environment in which tool can be used | Available outside of Tellus |
| User manual, API reference | - API reference - User guide |
| Changelog |