Global Mesh 2D Analysis Data Visualization Tool (L3/L4A)
- QGIS Plugin
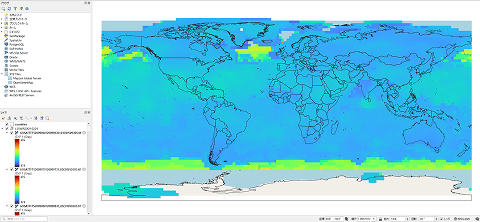
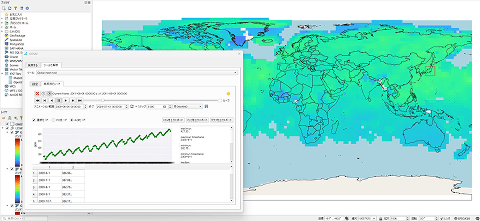
The tool can display a time-series animation of global mesh data showing the column-averaged mixing ratio data of CO2 and CH4, as well as their flux distribution data. It also provides the graph of analytical values for specific points of interest (POI) or areas of interest (AOI).
Features
Automatic color coding of GOSAT data to be used
When GOSAT data is downloaded and displayed on a map, it is shown in grayscale with QGIS's default settings. To improve visibility, you can assign appropriate colors to match the values for each scene. However, setting this individually for each dataset can be very time-consuming. By using this tool, you can apply color classification to multiple datasets at once.

Graphical display of GOSAT time-series data
By arranging and displaying the analyzed data of CO2 and CH4 concentrations, as well as emission and absorption values observed by GOSAT over time, you can examine changes in concentration of greenhouse gases across the globe. For example, if you prepare monthly CO2 concentration data for a certain year and specify a POI on the map, the changes in observation values for that location can be displayed as a time-series graph.
Displaying multiple years of data in a time series allows you to graph long-term changes in greenhouse gas concentrations. If you select an AOI, the tool can automatically calculate the average value within the range and visualize it in a graph.

Animated display of images in chronological order
Multiple selected scenes on a QGIS map can be played as an animation. This enables you to visually understand time-series changes across the entire globe.
Getting started
QGIS Installation Required
QGIS installation and setup is required. Please refer to the manual for preparation instructions.
GOSAT plugin usage manual (PDF)Target dataset
GOSAT
- GOSAT/L3/SWIR global CO2 distribution(G1-06)
- GOSAT/L3/SWIR global CH4 distribution(G1-07)
- GOSAT/L4A/global CO2 flux(G1-08)
- GOSAT/L4A/global CH4 flux(G1-09)
GOSAT-2
- GOSAT-2/L4A/global CO2 flux(G2-09)
*COG file (.tif) files for each dataset can be downloaded on QGIS.
Sample projects
For those who are unsure of how to search for and download data, we have prepared a sample project with data previously narrowed down by time period and data interval.
* The sample project is created using data as of March 2025. It may not include the latest data.
| Provider | Tellus |
|---|---|
| Terms of use | GOSAT Plugin Terms of Service |
| Notes | Please use the data in accordance with the GOSAT/GOSAT-2 Data Policy. |
| Environment in which tool can be used | Available outside of Tellus |
| User manual, API reference | GOSAT plugin usage manual |
| Changelog |