Tellus provides data from the Greenhouse Gases Observing Satellite “IBUKI” (GOSAT) series
in cooperation with the Ministry of the Environment and the National Institute for Environmental Studies.
About GOSAT
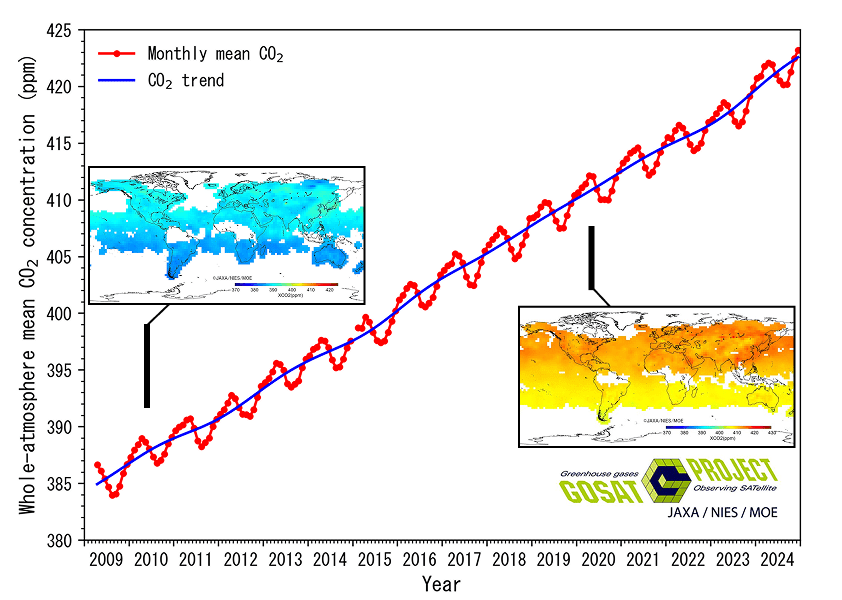
GOSAT (Greenhouse Gases Observing Satellite “IBUKI”), launched in January 2009, was the world’s first satellite dedicated to greenhouse gas measurement, observing global concentrations of greenhouse gases such as carbon dioxide (CO2) and methane (CH4). Scientists from more than 20 countries use GOSAT data for research and publish numerous scientific papers. GOSAT-2 (Greenhouse Gases Observing Satellite-2 “IBUKI-2”), the successor to GOSAT, was launched on October 29, 2018. The development of the succeeding satellite, GOSAT-GW (Greenhouse Gases and Water Cycle Observing Satellite), is currently underway. The GOSAT project is jointly promoted by the Ministry of the Environment (MOE), National Institute for Environmental Studies (NIES), and Japan Aerospace Exploration Agency (JAXA).
Global warming and greenhouse gases

The increase in atmospheric concentrations of greenhouse gases, such as carbon dioxide (CO2) and methane (CH4), is considered one of the factors influencing climate change on the Earth, and many countries are currently observing the concentration of these greenhouse gases.
However, the concentration of greenhouse gases was regionally uneven, and the lack of ground-based observation stations had led to significant uncertainties in estimating the absorption and emission of these gases. By analyzing observational data obtained from satellites like GOSAT, it enables us to understand the global distribution of CO2 and CH4, as well as to identify the regions where these greenhouse gases are emitted and absorbed. This includes the geographic distribution, seasonal variations, and interannual fluctuations of those greenhouse gases. These insights contribute to a deeper scientific understanding of the behavior of substances responsible for global warming and are utilized as fundamental information for enhancing future climate change predictions and formulating carbon emission reduction measures.
How to use on Tellus
Tellus is a satellite data platform of japan operating under the vision of “Create new value through Space × IT technology.” We provide an environment that not only offers satellite data but also facilitates the creation of new businesses utilizing satellite data. Tellus handles data from both domestic/international and public/commercial satellites, and users can search and obtain these data across various sources using Tellus Traveler.
Observation data from the GOSAT series is managed by NIESand is mainly used in the fields of academia, research, and climate change policy making. However, use of the observation data in business or private sectors has been hindered due to the need for specialized knowledge and data processing tools. By integrating GOSAT observation data in Tellus, it is now possible to search, display, and obtain images via a browser using Tellus Traveler. Users can also overlay GOSAT data with other satellite data available on Tellus. Furthermore, APIs are available for data search and retrieval making it easier to use in application development.

Dataset lineup available on Tellus
- GOSAT
- GOSAT/L2/SWIR CO2 column amount(G1-01)
- GOSAT/L2/SWIR CH4 column amount(G1-02)
- GOSAT/L2/SWIR H2O column amount(G1-03)
- GOSAT/L2/TIR CO2 vertical profile(Day side)(G1-04-1)
- GOSAT/L2/TIR CO2 vertical profile(Night side)(G1-04-2)
- GOSAT/L2/TIR CH4 vertical profile(Day side)(G1-05-1)
- GOSAT/L2/TIR CH4 vertical profile(Night side)(G1-05-2)
- GOSAT/L3/SWIR global CO2 distribution(G1-06)
- GOSAT/L3/SWIR global CH4 distribution(G1-07)
- GOSAT/L4A/global CO2 flux(G1-08)
- GOSAT/L4A/global CH4 flux(G1-09)
- GOSAT/L4B/global CO2 distribution(G1-10)
- GOSAT/L4B/global CH4 distribution(G1-11)
- GOSAT-2
- GOSAT-2/L2/SWIR CO2 column-averaged dry-air mole fraction(G2-01)
- GOSAT-2/L2/SWIR CH4 column-averaged dry-air mole fraction(G2-02)
- GOSAT-2/L2/SWIR CO column-averaged dry-air mole fraction(G2-03)
- GOSAT-2/L2/SWIR H2O column-averaged dry-air mole fraction(G2-04)
- GOSAT-2/L2/TIR CO2 vertical profile(Day side)(G2-05-1)* in preparation
- GOSAT-2/L2/TIR CO2 vertical profile(Night side)(G2-05-2)* in preparation
- GOSAT-2/L2/TIR CH4 vertical profile(Day side)(G2-06-1)* in preparation
- GOSAT-2/L2/TIR CH4 vertical profile(Night side)(G2-06-2)* in preparation
- GOSAT-2/L2/TIR H2O vertical profile(Day side)(G2-07-1)* in preparation
- GOSAT-2/L2/TIR H2O vertical profile(Night side)(G2-07-2)* in preparation
- GOSAT-2/L2/TIR temparature vertical profile(Day side)(G2-08-1)* in preparation
- GOSAT-2/L2/TIR temparature vertical profile(Night side)(G2-08-2)* in preparation
- GOSAT-2/L4A/global CO2 flux(G2-09)
- GOSAT-2/L4B/global CO2 distribution(G2-10)
- - Column Amount: The number of molecules contained in an imaginary column of air from the earth's surface to the top of the atmosphere per unit area
- - Column-Averaged Concentration: The concentration calculated by dividing the column amount of the observed substance by the column amount of dry air.
- - Concentration Altitude Distribution: The distribution of substance concentration at different altitudes (pressure levels). It is also referred to as the concentration profile.
Search, Browse, and Download
Go to Tellus TravelerRegistration for a Tellus account (free of charge) required to use Tellus Traveler.
A tool for visualizing the increase and decrease of greenhouse gases
Tellus has developed and released a dedicated plugin, “GOSAT Plugin,” which allows for the analysis of GOSAT series data on the open-source software QGIS (*).
By installing the GOSAT Plugin in QGIS, users can search and download the datasets provided by Tellus. Additionally, it enables data visualization through time-series animations and graphing numerical values at any point of interest.
(* QGIS is open-source software, and “QGIS” is a trademark of QGIS.ORG.)
The GOSAT Plugin offers four tools tailored to the datasets to be used.
- View Global Trends as a “Surface”
-
- 3D (by altitude)
- Global Mesh 3D Analysis Data Visualization Tool (L4B)
- View Observations at Specific Locations as a “Point Cloud”
-
- 3D (by altitude)
- Global Point Cloud 3D Observation Data Visualization Tool (L2 TIR)
-
- Global Mesh 2D Analysis Data Visualization Tool (L3/L4A)
-

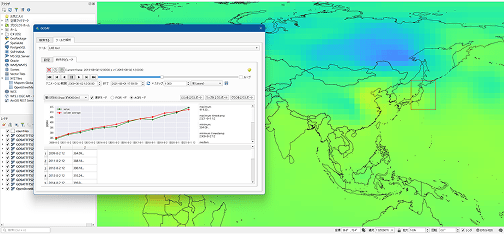
- The tool can display a time-series animation of global mesh data showing the column-averaged mixing ratio data of CO2 and CH4, as well as their flux distribution data. It also provides the graph of analytical values for specific points of interest (POI) or areas of interest (AOI).
- Details
-
- Global Mesh 3D Analysis Data Visualization Tool (L4B)
-

- The tool can display a time-series animation of three-dimensional distribution of CO2 and CH4 on a global mesh image. It also provides the graph of data for specific POI or AOI, with the function to switch to different pressure levels for display.
- Details
-
- Global Point Cloud 2D Observation Data Visualization Tool(L2 SWIR)
-

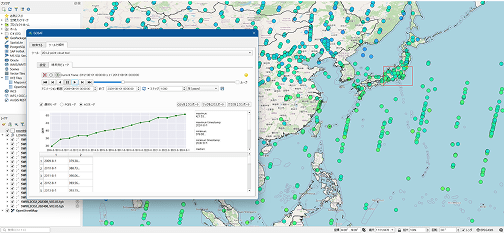
- The tool can display a time-series animation of column amounts for substances such as CO2 and CH4 as point cloud data. It also provides the graph of observed values for specific POI or AOI.
- Details
-
- Global Point Cloud 3D Observation Data Visualization Tool (L2 TIR)
-

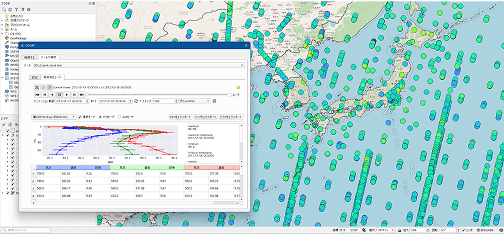
- The tool can display a time-series animation of concentration altitude distributions for substances such as CO2 and CH4 as point cloud data. It also provides the graph of observed values for specific POI or AOI, with the function to switch to different pressure levels for display.
- Details
How to use this service
This section describes the procedure to use the GOSAT plug-in.
Please refer to the “GOSAT Plugin User Manual (PDF)” for further details.
Step 1 Download QGIS and GOSAT plug-in
-
Download QGIS to your terminal
Operation confirmed versions: Ver3.34LTR
-
Download GOSAT plug-in
Please check the GOSAT Plugin Terms of Service (hereinafter referred to as “Terms”), and download the GOSAT Plugin ZIP file from the download URL listed at the bottom of the Terms.
Step 2 Tellus account registration and API token issuance
-
Tellus account registration (if you do not have a Tellus account)
-
Issuance of API Token
Step 3 Install the GOSAT plug-in and set up the API token
-
Install the GOSAT plug-in downloaded in Step 1 on QGIS.
-
Configure the API token in the plugin's settings screen in Step 2.
For first-time users Using sample projects for introduction
We have prepared the introductory sample projects for those who are unsure of which data and tools to use.
The introductory sample projects are packaged with GOSAT data and a file that can be opened with the data displayed on a layer in QGIS.
List of sample projects for introduction
Download and unzip the sample project zip file and launch the qgz file to start QGIS with the data set in layers.

You can use the GOSAT plug-in by launching it and selecting the corresponding tool name from “Analyze with Tools”.
In addition to the above, sample projects for each dataset are available on the description page of each tool.
For details, please refer to the description page of each tool.
* The sample project is created using data as of March 2025. It may not include the latest data.
For detailed instructions, please refer to the GOSAT Plugin User Manual.
GOSAT Plugin User Manual
| Note |
Please use the data in accordance with the GOSAT/GOSAT-2 Data Policy. Please use the tool in compliance with the GOSAT Plugin Terms of Service |
|---|---|
| Available Environment | User's own environment |
For inquiries, please contact us via the Inquiry Form.
Reference information
- The Ministry of the Environment , Japan:
- https://www.env.go.jp/earth/ondanka/gosat.html
- National Institute for Environmental Studies:
- https://www.nies.go.jp/soc/
In addition to this tool, analysis tools related to GOSAT are available on the website of the NIES. Please take a look at it as well.
